The impact of county-level racial composition on COVID-19 cases and deaths
An exploratory analysis of race and COVID-19 health burdens in the United States.
Code can be found in this Github repository.
Background
In spite of a general decline in morbidity and mortality over the last century in the United States, the ‘black health disadvantage’ has been a well-documented phenomenon, and a cause for great concern for scientists and public health officials (Farmer and Ferraro 2005). COVID-19 is no exception to this trend, with state-level research finding that blacks contract and die of COVID-19 at substantially higher rates than other racial groups (Anyane-Yeboa, Sato, and Sakuraba 2020). This existing inequality risks being widened by the underrepresentation of blacks in research relative to their disease burden (Borno, Zhang, and Gomez 2020). Prior studies on the causes for this disparity have been focused on socio-economic status (SES), and have found that SES differences alone fail to explain the racial health disparity (Do et al. 2008). Given this limitation, research has turned towards physical location and context, where environmental exposure, built environment, and social conditions in areas with predominantly black populations explain a large part of the discrepancy in health outcomes (Do et al. 2008).
This study seeks to build on prior literature by exploring the following question:
How does the racial composition of US counties relate to the number of confirmed cases and deaths per-capita from COVID-19?
While existing research on race and SARS-CoV-2 has been aimed at the state level, county-level research would add valuable information to help illustrate how racial compositions within states account for differences in harms caused by COVID-19. This study hypothesizes that counties with higher percentages of black individuals experience more cases and deaths per capita from COVID-19, while counties with higher white population percentages experience the opposite relationship.
Methodology
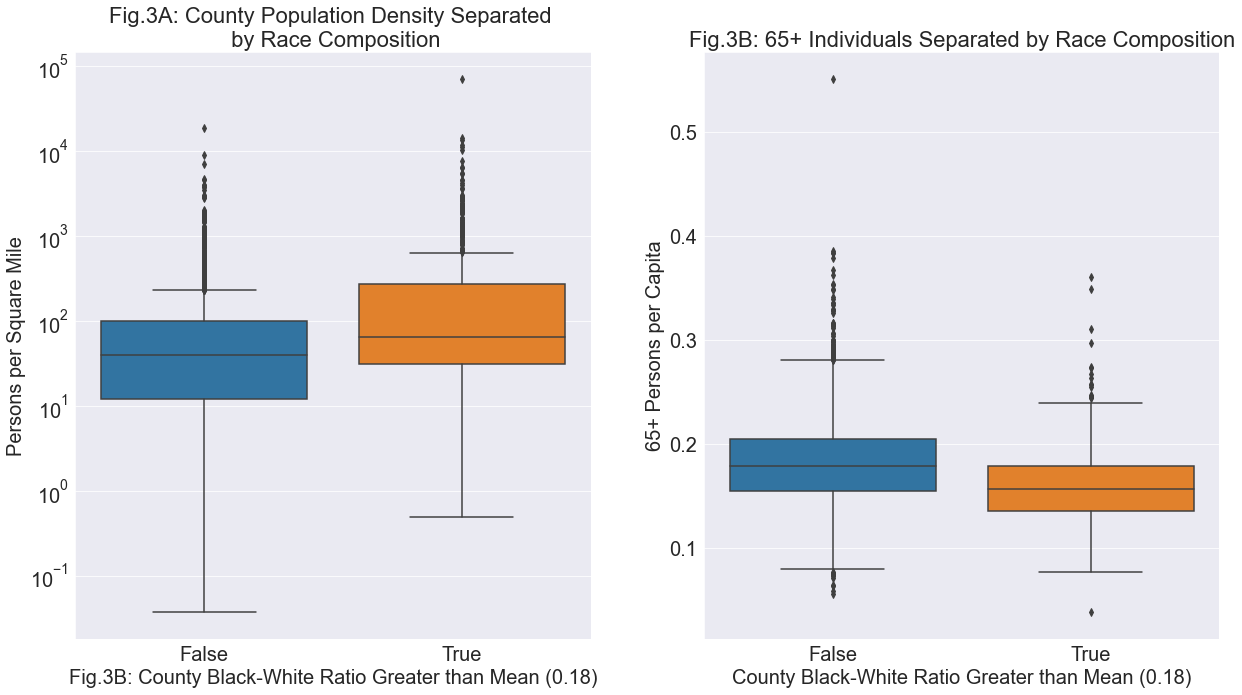
Prior to plotting cases and deaths based on the racial composition of county populations, it is important to note any distinct differences in the population densities or age distributions of counties with relatively more or less black individuals. Population density has been found to correlate positively with COVID-19 cases, therefore it would be a noteworthy caveat if one group was found to have counties with substantially different persons per square mile (Desmet and Wacziarg 2020). Additionally, understanding whether any systematic differences exist between the populations aged over 65 in each group would contribute valuable information on potential confounders, due to the increased risk of death from COVID-19 in older individuals (Goldstein and Lee 2020).
The second section, which is the focus of this study, presents how the relative percentage of the black and white population in each county relates to the number of confirmed cases per capita in each county. An analysis of the same nature is then created for deaths per capita in each county. This analysis first finds the percentage of black and white individuals relative to the total population in each county. Due to absolute differences in black and white population percentages, this analysis standardizes each county based on a z-score to determine the prevalence of each race relative to the average of all counties. The y-axes of Figure 4 and Figure 5, confirmed cases and deaths per capita, respectively, is calculated on a log scale to account for the high variation among values closer to zero, while still being able to account for the higher outlier cases.
Data
The data used in this analysis is from the United States Census Bureau API, specifically the American Community Survey 2014-2018 (ACS 14-18), which contains data on the total population, the population of each race, the land area, and the number of individuals over the age of 65 in each county (American Community Survey 2014-2018 5 Year Estimates 2019). The ACS 14-18 data is then merged with cumulative COVID-19 confirmed cases and deaths for each county on October 1st, 2020. In some states, such as Alaska, Louisiana, and Puerto Rico, areas that are functionally equivalent to counties are referred to as ‘Boroughs’, ‘Parishes’, ‘Municipios’, or other identifiers, which are inconsistently listed in ACS 14-18 and OxCovid19. These trailing words are found and removed to allow for clean merging and to minimize lost data. The statistics on COVID-19 were accessed from the OxCovid19 Database, with county-level cases and deaths reported by The New York Times (Mahdi et al. 2020).
Results
Population Density of Counties based on Race Ratios
The boxplots in Fig.3A summarize the population densities of counties with a black to white ratio less than versus greater than the total country mean. Due to dramatically varying population densities across US counties, a log scale allows for a clearer side-by-side comparison. The boxplots in Fig.3B depict the amount of individuals 65 or older per capita based on the same grouping. From these visualizations we see that counties with a black-white ratio above the mean, labelled ‘True’, tend to have greater population densities, with a median of 64.5 individuals per square mile compared to 40. We additionally observe that counties with a black-white ratio above the mean tend to have fewer individuals aged 65 or older per capita, with a median of 0.15 compared to 0.17. Interpreting these results, we may expect that counties above the mean black-white ratio would tend to experience more cases per capita due to density, while the younger population may convey a degree of protection from COVID-19 deaths.
COVID-19 Cases and Deaths by Black and White Prevalence in County
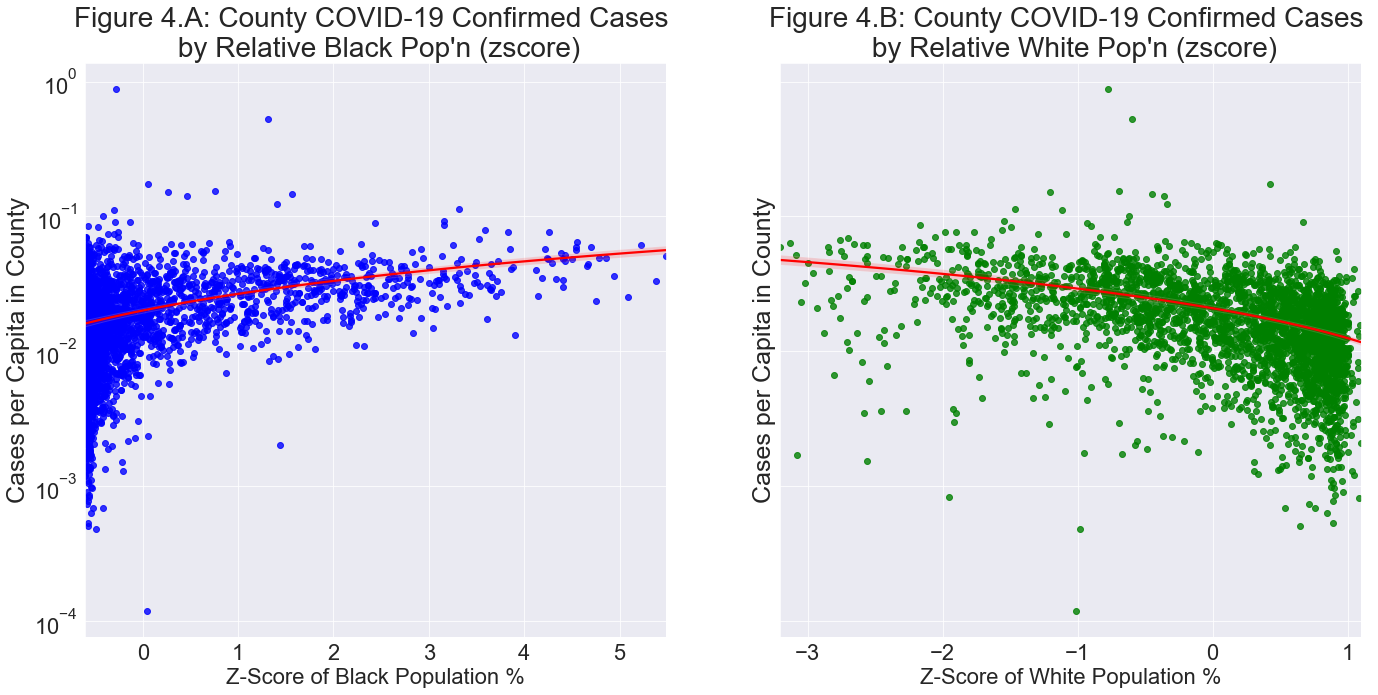
In Figure 4, we see two scatter plots representing each county’s confirmed cases per capita, on a log scale, separated on the x-axis by their relative population percentage of black and white individuals, respectively. In each plot, the point 0 on the x-axis represents the mean percentage of the black and white population in each county, which is 0.088 in Figure 4A, and 0.766 in Figure 4B. Each integer on the x-axis represents the number of standard deviations each county lies from the mean race percentage. The logarithm of confirmed cases per capita shows that as the relative amount of black individuals in counties increases, there is a positive association with the log-scaled number of confirmed cases, in line with our hypothesis. The relationship is reversed when observing the white population percentages, with counties tending to experience less cases as the proportion of white individuals increases.
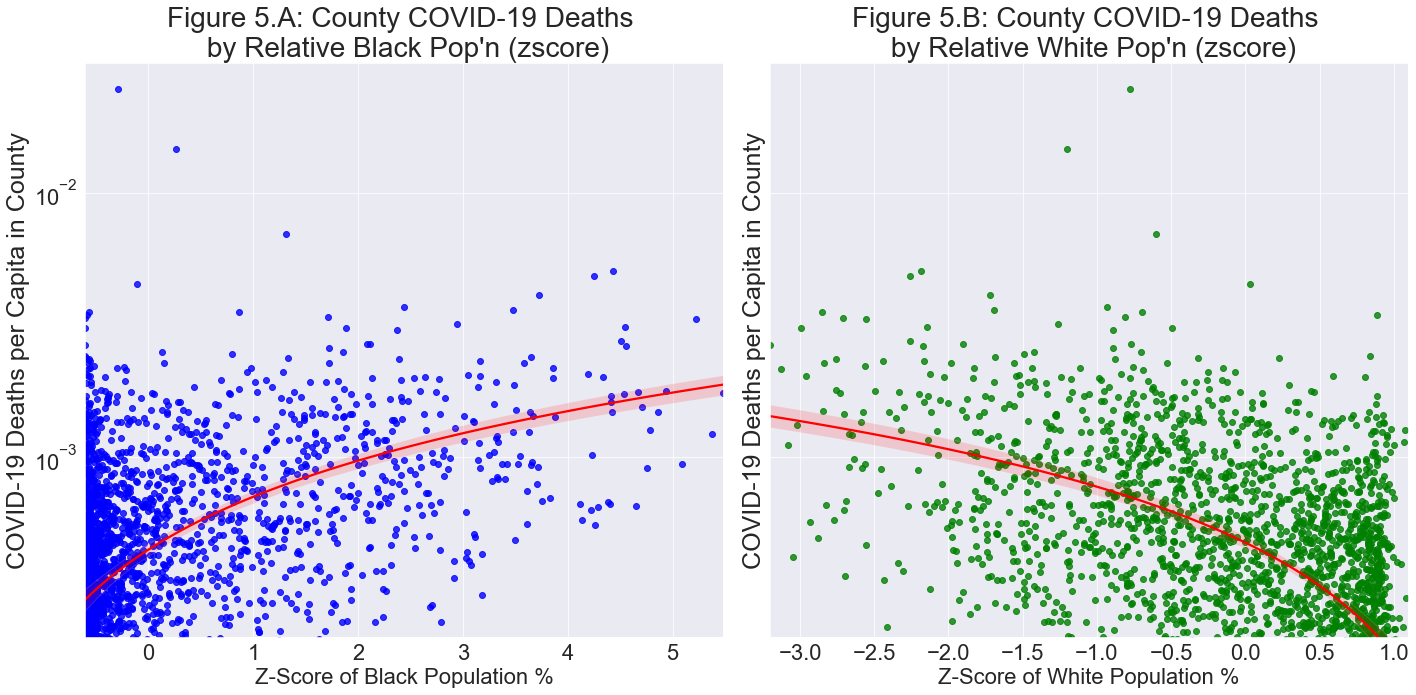
In Figure 5, we again observe two scatter plots showing the standardized percent of black and white populations in each county. Rather than log-scaled confirmed cases per capita as in Figure 4, the y-axis is the log-scaled deaths per capita from COVID-19 in each county. There appears to be an even stronger relation than in the former, with the log of deaths per capita increasing with the z-score of the black population in each county, conforming to the hypothesis. This relationship is reversed in the adjacent plot (Fig.5B), with log deaths per capita sharply decreasing as the standardized percentage of white individuals in a county increases.
The differences between the x-axes in both sets of side-by-side plots can be explained by observing the differences in absolute percentages of black and white individuals. The high concentration of counties in Fig.4A and Fig.5A on the left side of the plots is due to the high number of counties with 0% or slightly higher black population percentages. This phenomenon explains the right skewness of the scatterplot, as the percentage cannot go below zero, and these zero values pull the mean and standard deviation of black population percentages down. The opposite is true for the Fig.4B and Fig.5B. where the maximum z-score is 1.09 standard deviations above the mean (76.6%), which represents counties with 99.8% white populations. The lowest population percentage of white individuals Is 0.007%, which explains the large negative portion on the x-axis. To understand the influence of such extreme values, a z-score was calculated from the median during the creation of this study, which is more robust to outliers, with highly similar results. Due to the similarity of the two measures, the z-score was calculated using the mean, which is the more commonly applied method of standardization.
Discussion
The findings from Fig.4 and Fig.5 depict the racial health disparity as explored in the prior literature on the subject, and appear to confirm the hypothesis (Farmer and Ferraro 2005). We see that for both confirmed COVID-19 cases and deaths, counties that have relatively more black individuals have experienced more cases and deaths per capita than states with relatively fewer black people. This relationship is reversed when observing white individuals in the United States, with fewer cases and deaths being observed in states with higher proportions of white individuals. While more cases per capita could be partially explained by the greater population density of counties that have relatively more black individuals, the stark difference in death rate despite generally fewer individuals under the age of 65 per capita is highly concerning. This analysis contributes to prior work by showing that the racial health gap extends not only to state-level statistics, but is present on a county-level scale.
Limitations
A primary limitations of this study, and an avenue for future research on racial health disparities, is incorporating county-level COVID-19 hospitalization data, which was unavailable in the OxCovid19 Database or the Census Bureau API. An exploration of this data in relation to COVID-19 and the racial composition of counties may help illustrate a key portion of the health gap – access to hospital care (Verhagen et al. 2020). This analysis highlights that COVID-19 confirmed cases and deaths both increase as the proportion of black individuals in a county increases, a claim which hospitalization data may help support. For example, fewer hospitalization per capita as the proportion of black individuals increases may help to explain the findings of more deaths in these counties.
The racial health gap in the United States is not specific to its black population, but prevalent among Hispanics and Indigenous Populations (Buchmueller et al. 2016; Stoner et al. 2015). The decision to focus on black and white health relationships was motivated by a desire to tackle the research question with sufficient depth, given the cited literature and concern of the disproportionate impacts of COVID-19 on black individuals. Given the scarcity of COVID-19 research concerning racial and ethnic minorities, expanding the approaches used in this study to these populations may help to unconver the inflammatory effects of the pandemic on racial health inequalities.
References
U.S. Census Bureau. American Community Survey 2014-2018 5 Year Estimates. 2019.
Anyane-Yeboa, A., T. Sato, and A. Sakuraba. 2020. “Racial Disparities in COVID-19 Deaths Reveal Harsh Truths about Structural Inequality in America.” Journal of Internal Medicine 288(4): 479–80.
Borno, Hala T., Sylvia Zhang, and Scarlett Gomez. 2020. “COVID-19 Disparities: An Urgent Call for Race Reporting and Representation in Clinical Research.” Contemporary Clinical Trials Communications 19: 2451–8654.
Buchmueller, Thomas C., Zachary M. Levinson, Helen G. Levy, and Barbara L. Wolfe. 2016. “Effect of the Affordable Care Act on Racial and Ethnic Disparities in Health Insurance Coverage.” American Journal of Public Health 106(8): 1416–21.
Desmet, K, and R Wacziarg. 2020. UNDERSTANDING SPATIAL VARIATION IN COVID-19 ACROSS THE UNITED STATES. Cambridge, MA.
Do, D. Phuong et al. 2008. “Does Place Explain Racial Health Disparities? Quantifying the Contribution of Residential Context to the Black/White Health Gap in the United States.” Social Science and Medicine 67(8): 1258–68.
Farmer, Melissa M, and Kenneth F Ferraro. 2005. “Are Racial Disparities in Health Conditional on Socioeconomic Status?” Social Science & Medicine 60: 191–204.
Goldstein, Joshua R., and Ronald D. Lee. 2020. “Demographic Perspectives on the Mortality of COVID-19 and Other Epidemics.” Proceedings of the National Academy of Sciences of the United States of America 117(36): 35–41.
Kim, Soyoung, Youngsuk Ko, Yae Jean Kim, and Eunok Jung. 2020. “The Impact of Social Distancing and Public Behavior Changes on COVID-19 Transmission Dynamics in the Republic of Korea.” PLoS ONE 15(9): e0238684.
Larue, Bruno. 2020. “Labor Issues and COVID‐19.” Canadian Journal of Agricultural Economics/Revue canadienne d’agroeconomie 68(2): 231–37
Lauer, Stephen A. et al. 2020. “The Incubation Period of Coronavirus Disease 2019 (COVID-19) from Publicly Reported Confirmed Cases: Estimation and Application.” Annals of Internal Medicine 172(9): 577–82.
Lieberson, Stanley. 1964. “Limitations in the Application of Non-Parametric Coefficients of Correlation.” American Sociological Review 29(5): 744.
Adam Mahdi, Piotr Błaszczyk, Paweł Dłotko, Dario Salvi, Tak-Shing Chan, John Harvey, Davide Gurnari, Yue Wu, Ahmad Farhat, Niklas Hellmer, Alexander Zarebski, Bernie Hogan, Lionel Tarassenko. 2020. “Oxford COVID-19 Database: a multimodal data repository for better understanding the global impact of COVID-19”. University of Oxford.
Merow, Cory, and Mark C. Urban. 2020. “Seasonality and Uncertainty in Global COVID-19 Growth Rates.” Proceedings of the National Academy of Sciences 117(44): 202008590
Ratnesar-Shumate, Shanna et al. 2020. “Simulated Sunlight Rapidly Inactivates SARS-CoV-2 on Surfaces.” Journal of Infectious Diseases 222(2): 214–22.
Salvador, Cristina E. et al. 2020. “Relational Mobility Predicts Faster Spread of COVID-19: A 39-Country Study.” Psychological Science 31(10): 1236-1244.
Singer, Merrill, Nicola Bulled, Bayla Ostrach, and Emily Mendenhall. 2017. “Syndemics and the Biosocial Conception of Health.” The Lancet 389(10072): 941–50.
Stoner, Lee et al. 2015. “The Indigenous Health Gap: Raising Awareness and Changing Attitudes.” Perspectives in Public Health 135(2): 68–70.
Verhagen, Mark et al. 2020. “Forecasting Spatial, Socioeconomic and Demographic Variation in COVID-19 Health Care Demand in England and Wales” ed. David Brazel. BMC Medicine 18, 203.